DBAs are all about transparency – transparency hopefully about what’s going on with the SQL server. Things like connections and utilization and all of that. You have many standard tools that monitor and analyze your SQL Server, but you also have access to other tools native to the AWS platform. It’s surprising the granularity you can drop down into just using CloudWatch to set up monitors – and alerts.
The alerting system very strong – pretty much anything you have information about in the system can be set to have an alert response to text message or email, for example. You have some initial reporting key facts on the SQL Server RDS interface in the RDS console. These are the basics of utilization and something you can review in real-time (depends on the reporting you have enabled for your instance) and will give you a heads-up.
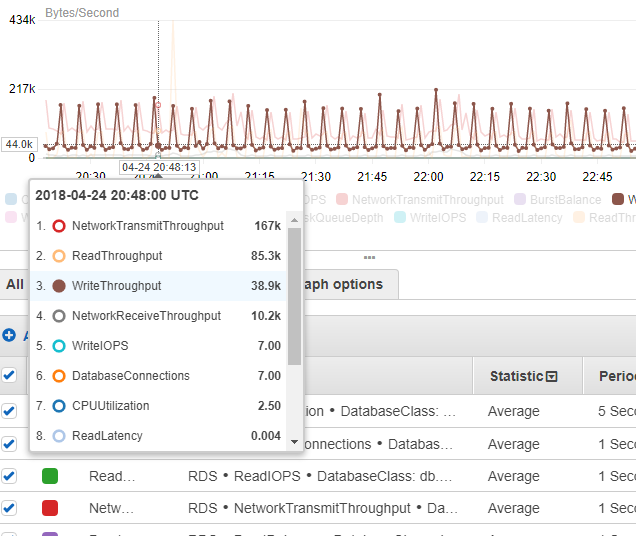
When we’ve been troubleshooting things like instance sizing and utilization type things, this has proven to consistently give us the clues to what we need to chase down. But in CloudWatch you also have additional elements – (see image for some examples) – things you can typically turn to in order to figure out how your system is running.
But one of the things that really helps is that ability to set up Alarms. So as you cross certain thresholds you can see how your server is performing and living in the cloud environment. This is extremely important to setting things up and having them be proactive in letting you know there may be issues.
One of my personal favorites is defining that different level of alert – that “may be an issue” level and using that as an alarm that notifies me. It can be really helpful to get a warning shot over the bow as you manage your systems, before things go critical and are in a true problem state. You can get nicely granular on these alerts – when you set up the alarm, you can select the relative sphere of importance – from database engine to the database class on the whole, etc. This has saved us several times in helping to point out where to start looking in the system if things are just off.
Perhaps one of the most helpful things though is that warning ability. Being able to find out as things are building (say, latency values or connections are building and you know you don’t want to exceed a specific quantity at your instance size) before they hit the wall has proven very helpful.
The overall point of this is that it’s critical to dig in to your providers reporting and alerting system for your SQL Server. You’ll find some very powerful systems there that will help you better understand how it’s running in the cloud, how it’s interacting with the environment and how it’s working for your applications. Personally, when things aren’t quite what I expected with a system, I’m clamoring for more information. More monitoring. More heads-up about what could be happening, as it’s happening. CloudWatch is a great tool to use for your AWS installations and can bring good awareness across systems, and good detail awareness as well.